

Fuel Burn Down Cycle since Apr 21, 2025
NukeWorker's Operational Excellence Score 5-yr composite · ranks 31 of 93 →
Operational
Excellence Score
McGuire 1 ranks #31 of 93 active US units on NukeWorker's Operational Excellence Score over the 5-year window. Strongest area: Capacity Factor (81th percentile). Weakest: Refuel Duration (30th percentile).
Per-dimension breakdown (7 metrics)
Each dimension's percentile is computed across the active US fleet (93 units with sufficient history). Sub-score = average of its component percentiles. Composite = average of the three sub-scores. 5-year window. View full leaderboard →
Methodology
NukeWorker's Operational Excellence Score is a composite ranking that combines 7 publicly observable performance metrics into a single 0-100 number per US nuclear unit.
How it's computed: Each unit's raw value is converted to a percentile (0-100) within the 93 active US units that have at least 2 completed refueling cycles. The 7 percentiles are averaged into 3 sub-scores (Reliability, Efficiency, Discipline), and those are averaged into the final composite.
Active window — 5-year:
- Reliability — Capacity factor (5yr), forced outage days/yr (5yr), B2B avg streak (lifetime)
- Efficiency — in-cycle fuel utilization (3yr), median refuel duration (5yr)
- Discipline — robust mean startup duration, scrams/yr (5yr, annualised)
Cohort rankings: alongside the fleet rank, each unit gets ranked within its reactor type (PWR/BWR), containment design (Ice Condenser, Mark I, etc.), and cycle length (12/18/24-month). Useful for apples-to-apples comparisons.
What's excluded: subjective community ratings, confidential INPO ratings, financial metrics. We only use publicly available NRC + cycle data.
Why three windows? 5yr (default) is the industry standard. 3yr captures recent operational changes and post-pandemic recovery. Lifetime gives newer units a fair comparison and reveals long-term consistency.
Edge cases: units with fewer than 2 cycles (e.g., Vogtle 4) show "Provisional". Decommissioned units excluded.
Refresh cadence: recomputed daily. Each window cached separately.
A data-derived proxy for operational performance; not affiliated with INPO. INPO ratings are confidential and qualitative — ours is public and quantitative.
Capacity Factor (365-Day)
Breaker-to-Breaker Runs 7 runs
| 2023-10-25 | 2025-04-02 | 525 days |
| 2022-05-09 | 2023-09-16 | 495 days |
| 2020-10-21 | 2022-04-02 | 528 days |
| 2019-05-05 | 2020-09-19 | 503 days |
| 2016-04-17 | 2017-09-23 | 524 days |
| 2008-11-13 | 2010-03-14 | 486 days |
| 2002-10-10 | 2004-03-07 | 514 days |
Scram History 6 events since 2011
Outage Duration Trend
?Power History (12-Month)
?Outage Days by Year
?Facility Statistics
NukeWorker Member Ratings 1 vote
Facility Map
35.4325, -80.9478
Location & Contact
Per Diem Rates FY 2026
Unemployment Benefits NC
Jobs at McGuire 5 active
More Jobs in NC 15 active
Photos
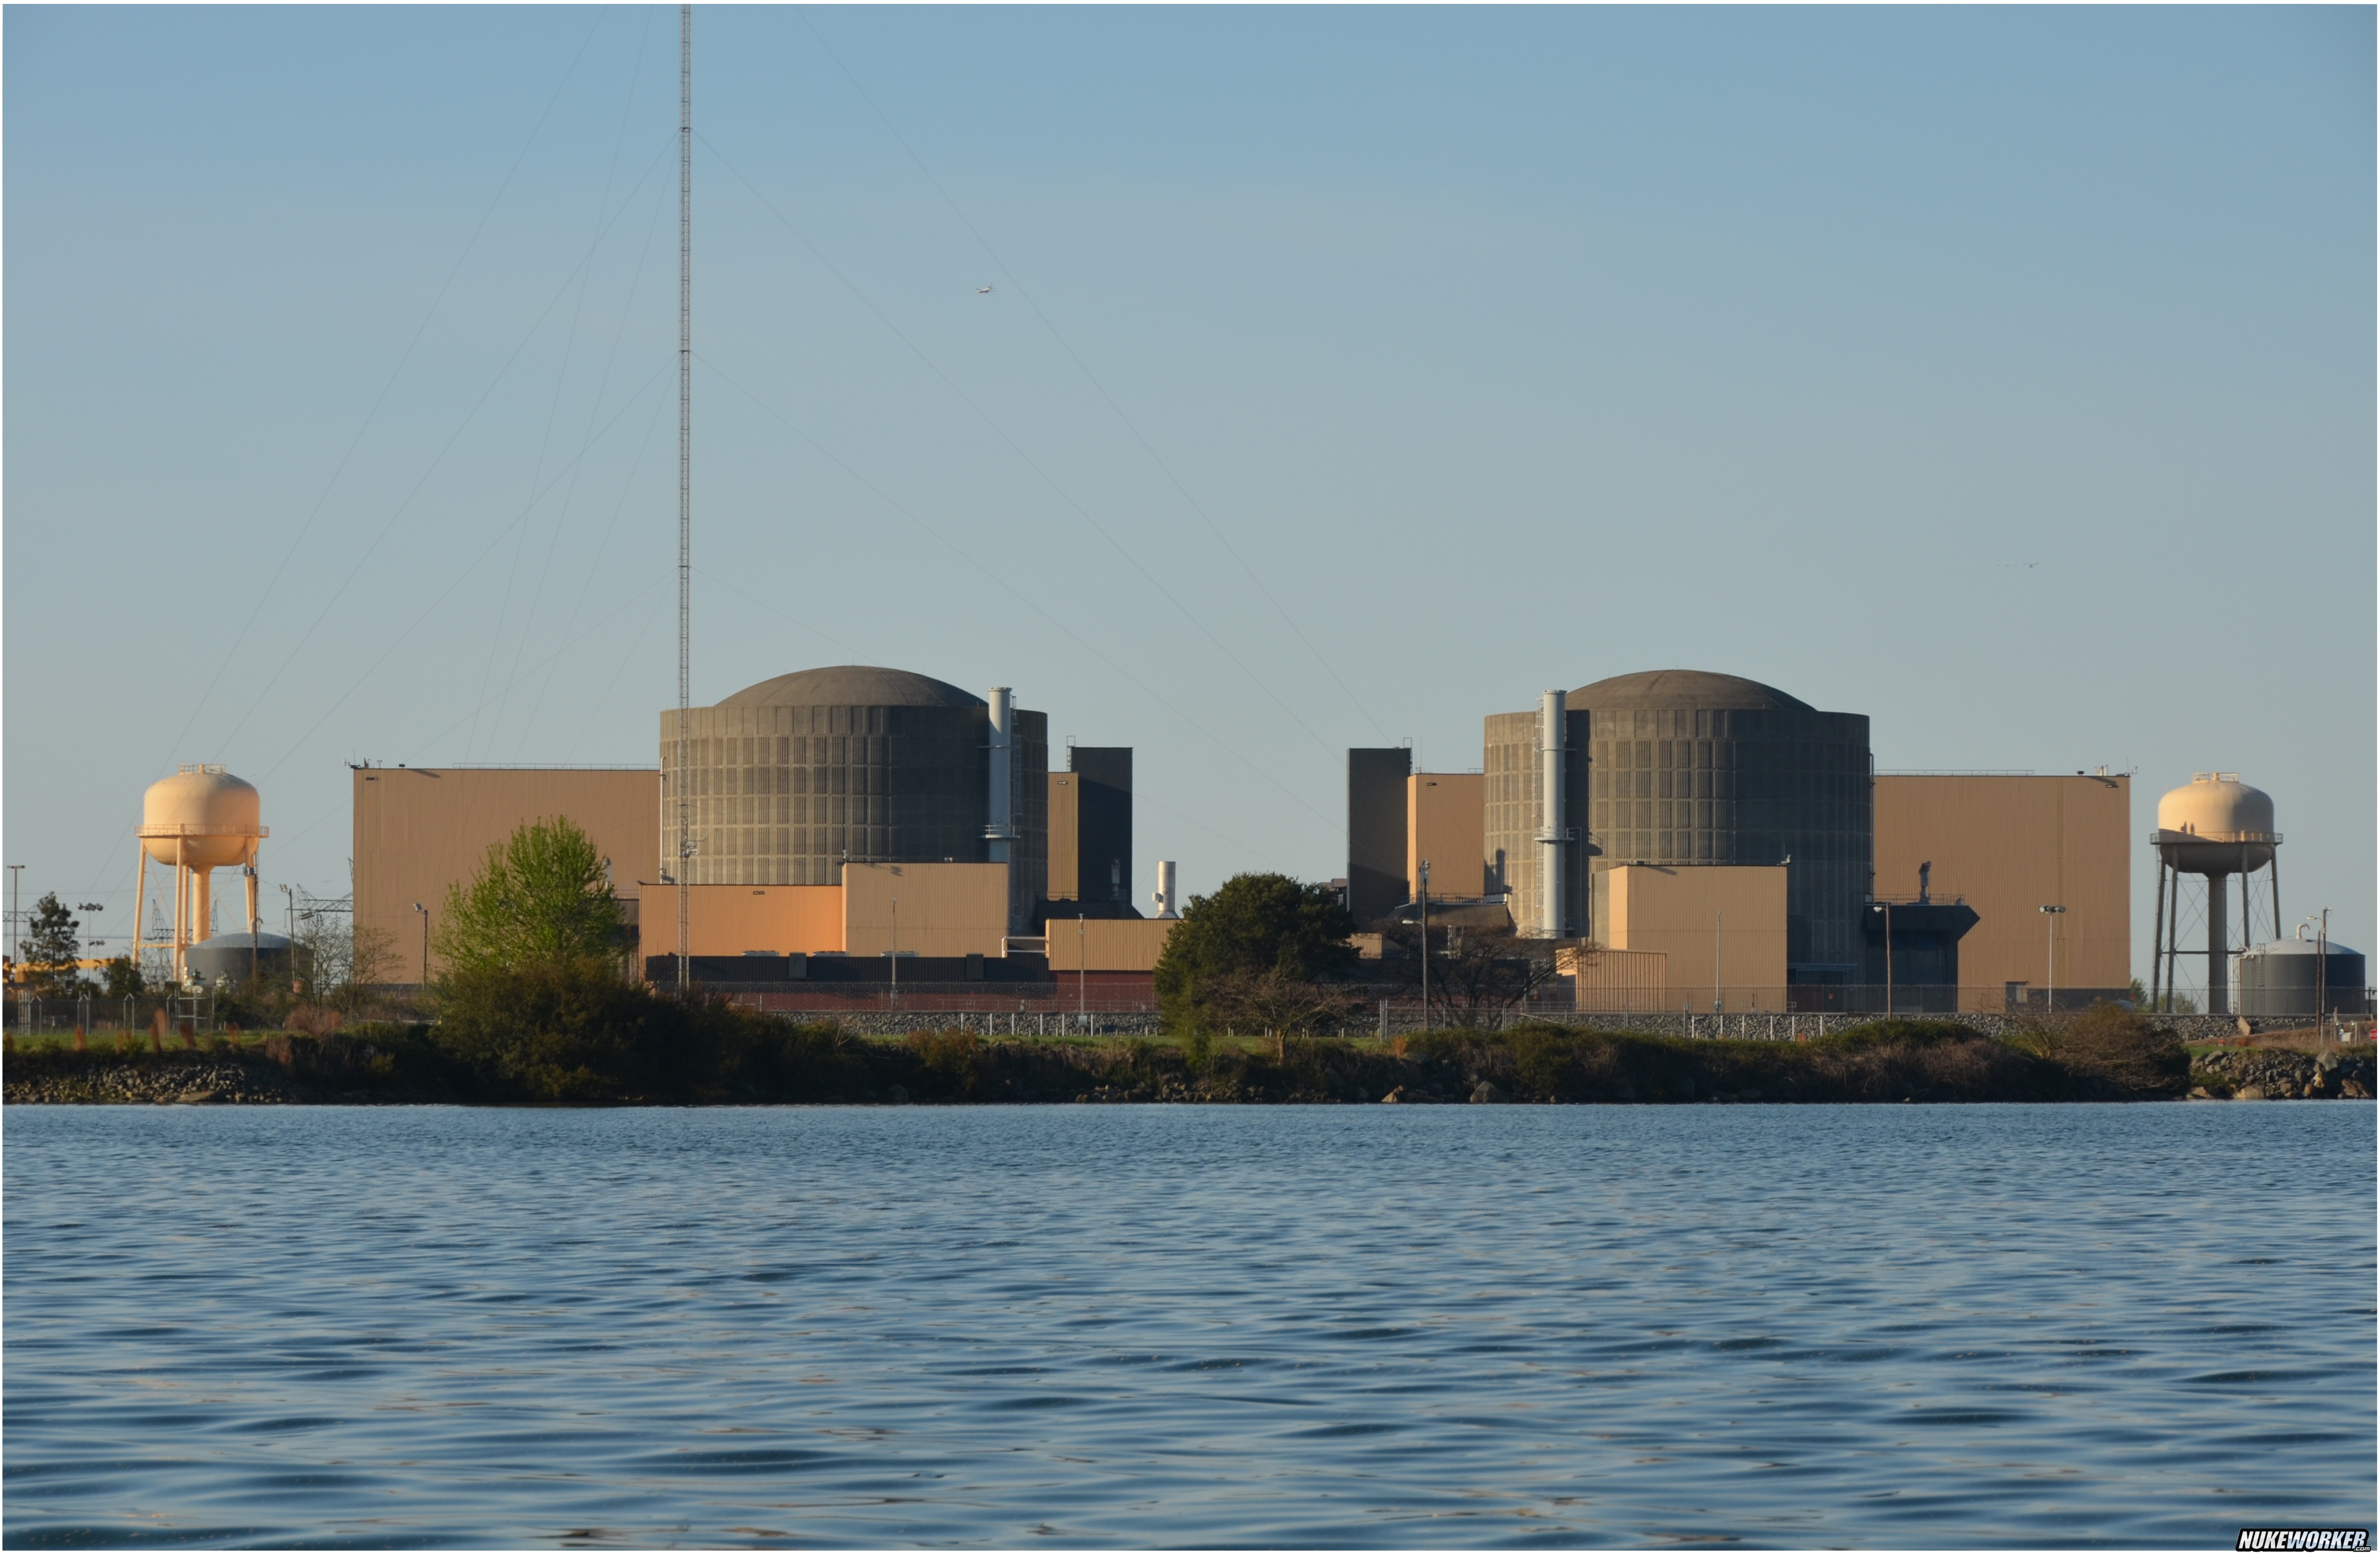


 of electricity. Consider this – in its first full year of operation, McGuire unit 1 produced more than 4 million MWh.
35 views")


