
Fuel Burn Down Cycle since Jul 8, 2025
This unit has accumulated 19.7 FPD of unburned fuel from cycle downtime — that's free margin to extend the cycle if operators want.
NukeWorker's Operational Excellence Score 5-yr composite · ranks 86 of 93 →
Operational
Excellence Score
Callaway ranks #86 of 93 active US units on NukeWorker's Operational Excellence Score over the 5-year window. Strongest area: Scrams (5-year) (47th percentile). Weakest: Refuel Duration (6th percentile).
Per-dimension breakdown (7 metrics)
Each dimension's percentile is computed across the active US fleet (93 units with sufficient history). Sub-score = average of its component percentiles. Composite = average of the three sub-scores. 5-year window. View full leaderboard →
Methodology
NukeWorker's Operational Excellence Score is a composite ranking that combines 7 publicly observable performance metrics into a single 0-100 number per US nuclear unit.
How it's computed: Each unit's raw value is converted to a percentile (0-100) within the 93 active US units that have at least 2 completed refueling cycles. The 7 percentiles are averaged into 3 sub-scores (Reliability, Efficiency, Discipline), and those are averaged into the final composite.
Active window — 5-year:
- Reliability — Capacity factor (5yr), forced outage days/yr (5yr), B2B avg streak (lifetime)
- Efficiency — in-cycle fuel utilization (3yr), median refuel duration (5yr)
- Discipline — robust mean startup duration, scrams/yr (5yr, annualised)
Cohort rankings: alongside the fleet rank, each unit gets ranked within its reactor type (PWR/BWR), containment design (Ice Condenser, Mark I, etc.), and cycle length (12/18/24-month). Useful for apples-to-apples comparisons.
What's excluded: subjective community ratings, confidential INPO ratings, financial metrics. We only use publicly available NRC + cycle data.
Why three windows? 5yr (default) is the industry standard. 3yr captures recent operational changes and post-pandemic recovery. Lifetime gives newer units a fair comparison and reveals long-term consistency.
Edge cases: units with fewer than 2 cycles (e.g., Vogtle 4) show "Provisional". Decommissioned units excluded.
Refresh cadence: recomputed daily. Each window cached separately.
A data-derived proxy for operational performance; not affiliated with INPO. INPO ratings are confidential and qualitative — ours is public and quantitative.
Capacity Factor (365-Day)
Breaker-to-Breaker Runs 5 runs
| 2017-12-18 | 2019-04-01 | 469 days |
| 2016-05-10 | 2017-10-07 | 515 days |
| 2011-11-25 | 2013-04-09 | 501 days |
| 2010-06-12 | 2011-10-16 | 491 days |
| 2007-05-09 | 2008-10-11 | 521 days |
Scram History 9 events since 2011
Outage Duration Trend
?Power History (12-Month)
?Outage Days by Year
?Facility Statistics
NukeWorker Member Ratings 33 votes
Facility Map
38.7594, -91.7855
Location & Contact
Per Diem Rates FY 2026
Unemployment Benefits MO
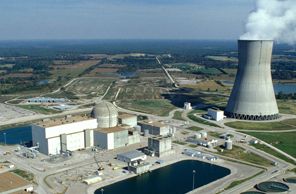
Photos