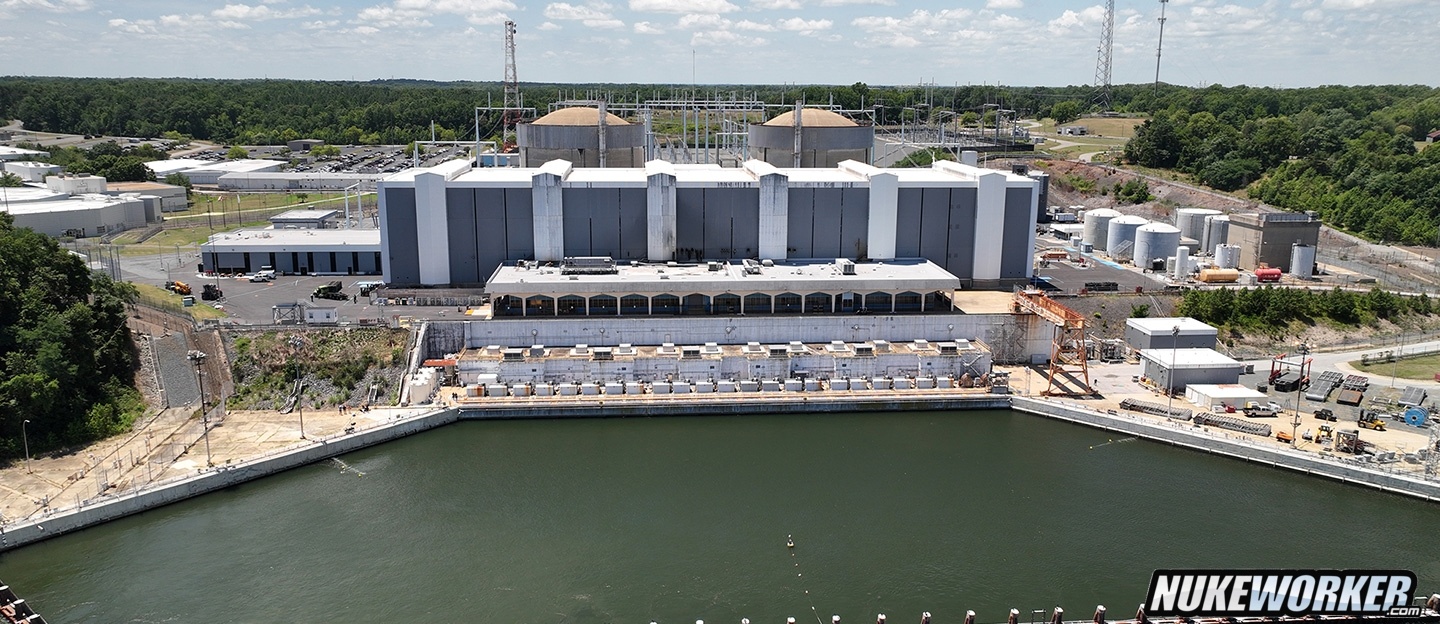

Calvert Cliffs 1 — Nuclear Reactor Data & Live Status

Live reactor status, daily power data, outage history & performance charts, scram history, capacity factor & statistics, community ratings, technical specifications, NRC licensing data, photos, nearby jobs, satellite map, contact information, and per diem rates for Calvert Cliffs 1.

?
Composite Operational Excellence Score (0-100) — average percentile rank across 7 dimensions in three sub-scores: Reliability (capacity factor, forced outage days, B2B avg streak), Efficiency (fuel utilization, refuel duration), and Discipline (startup duration, scram count). 5-year window. Higher = more operationally excellent. Click to see the full breakdown.
78
Excellence
#8 of 93
Top Quartile
?
Current reactor power level from the most recent NRC daily report.
100%
Power
ONLINE
?
Days of continuous operation since the last outage ended. Ranked against all operating units.
125
Current Run
days
#55 of 95
Mid Quartile
?
Longest recorded period of continuous operation between outages.
716
Record Run
days
#29 of 95
Mid Quartile
?
Breaker-to-Breaker runs — continuous operation exceeding the cycle-adjusted threshold (623 days for this 24-month cycle unit) with no trips to 0% power.
4
B2B Runs
#49 of 86
Mid Quartile
?
Lifetime capacity factor: average power level across all recorded days (100% = always at full power). Ranked against all NRC-tracked units.
93.1%
Capacity Factor
#13 of 95
Top Quartile
?
Net electricity actually generated over the most recent 12 months reported by the U.S. Energy Information Administration (Form EIA-923), summed across every unit at this plant. These are authoritative actuals, not an estimate.
14.9 TWh
Net Generation
EIA-923 · 12 mo to 2026-04 · plant total
?
Community rating score (Bayesian-adjusted). Based on 70 votes. Ranked against all rated facilities.
53.5
Rating
70 votes
#44 of 97
Mid Quartile
?
Total NRC-reported scram events (emergency reactor shutdowns). Ranked fleet-wide — fewer scrams = better rank.
6
Scrams
#38 of 94
Mid Quartile
?
Years since commercial operation began. License remaining: 8 years.
51.2
Operating Age
years
8 yrs remaining

Reactor Status Timeline

Online NRC data, Mon to Fri ? Actual daily reactor status from NRC reports (Mon to Fri), the current state, and what is coming: the utility's published Scheduled outage plus, for subscribers, NukeWorker's model Projection. Colored by status. How far ahead you can see depends on your plan.
Aug2025SepOctNovDecJan2026FebMarAprMayJunJulAugOnline: Jul 17, 2025 to Feb 11, 2026Coastdown: Feb 12, 2026Online: Feb 13, 2026Coastdown: Feb 14, 2026 to Feb 15, 2026Refueling Outage: Feb 16, 2026 to Mar 14, 2026Power Ascension: Mar 15, 2026 to Mar 16, 2026Online: Mar 17, 2026 to Jul 17, 2026Today
OnlineCoastdownPower AscensionRefueling Outage
Full history & analysis →
?
Composite Operational Excellence Score for Calvert Cliffs 1 — average percentile rank across 7 publicly observable metrics in three sub-scores: Reliability (capacity factor, forced outage days, B2B avg streak), Efficiency (fuel utilization, refuel duration), and Discipline (startup duration, scram count). Toggle the time window (3yr / 5yr / Lifetime) to see how this unit's standing shifts. Each dimension percentile-ranked across the active US fleet. Sub-score = average of components. Composite = average of the three sub-scores.

NukeWorker's Operational Excellence Score 5-yr composite · ranks 8 of 93

NukeWorker scores Calvert Cliffs 1's operational excellence at 78 out of 100 over the past five years, ranking it 8 of 93 reactors in the active US fleet. The score blends reliability, efficiency, and operating discipline drawn from public performance data.
Time window
NukeWorker's
Operational
Excellence Score
78/100
Top Quartile · #8/93
5-year window

Calvert Cliffs 1 ranks #8 of 93 active US units on NukeWorker's Operational Excellence Score over the 5-year window. Strongest area: Scrams (5-year) (90th percentile). Weakest: Forced Outage Days/yr (55th percentile).

Reliability
69
Capacity factor + Forced outages + B2B streaks
Efficiency
77
Fuel utilization + Refuel duration
Discipline
86
Startup duration + Scram count
Cohort Rankings apples-to-apples comparison within each peer group
Reactor type: #5 of 61 PWR
Containment: #5 of 47 Dry Ambient (PWR)
Cycle length: #5 of 40 24-month cycle
Fleet rank above (8 of 93) compares all active US units; cohort ranks compare only against units sharing this property.
Per-dimension breakdown (7 metrics)
Capacity Factor 80th
94.7% (higher better, Reliability)
Forced Outage Days/yr 55th
2.8d (lower better, Reliability)
B2B Avg Streak 73th
685d (higher better, Reliability)
Fuel Utilization 66th
98.3% (higher better, Efficiency)
Refuel Duration 88th
20d (lower better, Efficiency)
Startup Duration 82th
3.3d (lower better, Discipline)
Scrams (5-year) 90th
0.0/yr (lower better, Discipline)

Each dimension's percentile is computed across the active US fleet (93 units with sufficient history). Sub-score = average of its component percentiles. Composite = average of the three sub-scores. 5-year window. View full leaderboard →

Methodology

NukeWorker's Operational Excellence Score is a composite ranking that combines 7 publicly observable performance metrics into a single 0-100 number per US nuclear unit.

How it's computed: Each unit's raw value is converted to a percentile (0-100) within the 93 active US units that have at least 2 completed refueling cycles. The 7 percentiles are averaged into 3 sub-scores (Reliability, Efficiency, Discipline), and those are averaged into the final composite.

Active window — 5-year:

  • Reliability — Capacity factor (5yr), forced outage days/yr (5yr), B2B avg streak (lifetime)
  • Efficiency — in-cycle fuel utilization (3yr), median refuel duration (5yr)
  • Discipline — robust mean startup duration, scrams/yr (5yr, annualised)

Cohort rankings: alongside the fleet rank, each unit gets ranked within its reactor type (PWR/BWR), containment design (Ice Condenser, Mark I, etc.), and cycle length (12/18/24-month). Useful for apples-to-apples comparisons.

What's excluded: subjective community ratings, confidential INPO ratings, financial metrics. We only use publicly available NRC + cycle data.

Why three windows? 5yr (default) is the industry standard. 3yr captures recent operational changes and post-pandemic recovery. Lifetime gives newer units a fair comparison and reveals long-term consistency.

Edge cases: units with fewer than 2 cycles (e.g., Vogtle 4) show "Provisional". Decommissioned units excluded.

Refresh cadence: recomputed daily. Each window cached separately.

A data-derived proxy for operational performance; not affiliated with INPO. INPO ratings are confidential and qualitative — ours is public and quantitative.

5-yr trend: 2021: 85/100 (#4/93)2022: 86/100 (#5/92)2023: 88/100 (#5/92)2024: 89/100 (#5/93)2025: 85/100 (#8/93)2026: 83/100 (#8/93) Stable vs 2025
Compare Calvert Cliffs 1 head-to-head with up to 3 other units. Compare now

Capacity Factor (365-Day)

?
100%
Current
92.2%
365-Day Avg
#19
of 94 plants
Min: 0% Max: 100% 29 days <80%

Outage Duration Trend

?
Scheduled refueling outage durations over time. Green bars are below average, yellow near average, red above. Dashed line shows the plant's historical average. Shorter outages mean better execution.
Calvert Cliffs 1 has completed 14 scheduled refueling outages on record, averaging 38 days each. The most recent, in Feb 2026, ran 27 days.

Power History (12-Month)

?
Daily power output as a percentage of rated capacity over the past 365 days. Green segments indicate full power (90%+), yellow shows reduced output, and red indicates significant power reductions or shutdowns.
Over the past 12 months Calvert Cliffs 1 has run at an average of 92.2% of rated power. On the chart, green stretches are full-power running and dips toward zero mark reduced output or outages.

Outage Days by Year

?
Total days spent in outage each year, split by scheduled refueling (blue) and forced/unplanned (red). Lower totals indicate better reliability and outage execution. Hover for details.
Across its recorded history, Calvert Cliffs 1 has spent 529 days in scheduled refueling outages and 87 days in forced or unplanned outages. Taller bars mark the years with the most downtime.

Facility Statistics

?
Key performance and lifecycle metrics calculated from NRC operational data. Includes operating age, construction timeline, capacity factor, efficiency, generation totals, and reliability records.
Calvert Cliffs 1 has operated for about 51.2 years and averaged a 93.1% lifetime capacity factor, generating roughly 197.5 TWh of electricity. Its longest unbroken run reached 716 days.
Lifecycle & Tenure
Operating Age: 51.2 Yrs
Build Time: 5.8 Yrs
Lic. Remaining: 8 Yrs
Production & Power
Lifetime CF: 93.1%
Efficiency: 32.3%
Generated: 197.5 TWh
Reliability & Outages
Record Run: 716 Days
Refuelings: 14
Avg Startup: 3.1 Days

Location & Contact

?
Physical address, phone number, and website for this facility. Use the directions link to get driving directions via Google Maps.
Address:
1650 Calvert Cliffs Parkway
Lusby, MD 20657, USA
Get Directions
Phone: (410) 495-4600

Per Diem Rates FY 2026

?
Per diem covers lodging and meals & incidental expenses (M&IE) for government and contractor travel near this facility. Rates are from GSA for FY 2026.
$110
Lodging/Night
$68
M&IE/Day
$178
Total/Day
Standard Rate, MD

Unemployment Benefits MD

?
Maximum state unemployment insurance benefits for MD. Actual benefits depend on your earnings history and may be lower than the maximum. Data as of Jan 2026.
$430
Max Weekly
26
Max Weeks
$11,180
Max Total

Ownership & Construction

?
The utility or company that owns and operates the facility, the architect-engineer responsible for plant design, and the primary construction contractor. Click names to view all facilities by that entity on the map.
Owner/Operator: Constellation Energy
Architect Engineer: BECH
Constructor: BECH

Technical Specs

?
Reactor design specifications including type (PWR/BWR), containment design, nuclear steam supply system manufacturer, thermal and electrical power ratings, and current operational status.
Reactor Type: PWR
Containment: PWR-DRYAMB
NSS Supplier: COMB CE
Thermal Power: 2737 MWt
Net Capacity: 884 MWe
Efficiency: 32.3%
Status: Operating

Licensing

?
NRC licensing history including docket number, license type and number, construction permit date, operating license issuance, commercial operation date, license renewal, and expiration date.
Docket #: 05000317
License #: DPR-53
License Type: OL-FP
Const. Permit: 1969-07-07
Operating Lic: 1974-07-31
Commercial Op: 1975-05-08
License Renewed: 2000-03-23
License Exp: 2034-07-31

Market & Region

?
EIA market and grid-region classifications: NERC reliability region, U.S. Census region, balancing authority responsible for grid operations, and whether the unit operates as a rate-regulated utility or a competitive merchant generator. Hover any value for the full name.
NERC Region: RFC — Reliability First Corporation
Census Region: SAT — South Atlantic
Balancing Authority: PJM — PJM Interconnection (ISO/RTO)
Market Structure: Merchant — Competitive generator selling into wholesale markets